Size your vertical market with trade show data
Trade shows are the living census of every industry. Whoever exhibits is investing to sell. DataOrigin tracks more than 30,000 trade shows and shows you which companies exhibit at each one, with industry, country and size, so you can size a vertical market with real companies instead of generic reports.
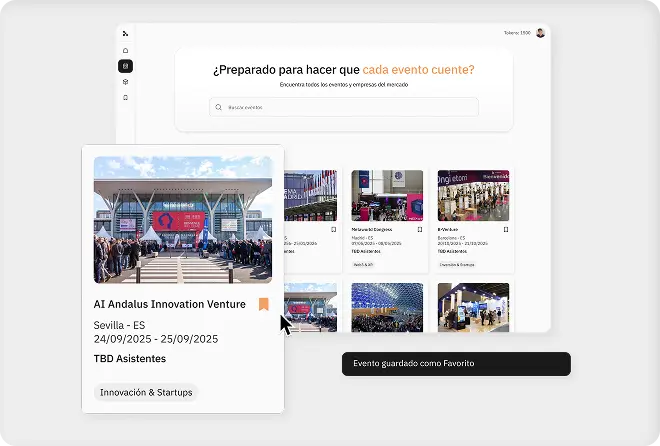
Analyzing a market without field data
Expensive, outdated reports
Third-party market studies cost thousands, arrive late and rarely go down to the level of named companies.
New markets with no map
Entering a new country or vertical without knowing which players operate there forces you to decide on intuition where you need names.
Emerging segments you cannot see
Growing niches show up on the exhibition floor first. If you do not follow their shows, you spot them once they already have a leader.
From industry to company census in four steps
- 1
Locate the trade shows of your vertical
Filter more than 30,000 shows by industry and country to find the events where your market concentrates.
- 2
Extract and segment the census
The companies exhibiting at each event, with industry, country, size and website. Slice it by the criteria that define your analysis.
- 3
Compare markets through twin shows
The same industry exhibits at different shows and countries. Compare editions and geographies to see where the real density is.
- 4
Export your analysis
Take the data to CSV, Excel or Google Sheets, or hand it to your sales team with the ICP prioritization already done.
From business question to market census
The vertical, scoped
The team locates the shows where their niche exhibits across Europe and picks the three with the highest company density.
The census, built
Exhibitors from the three shows, deduplicated and segmented by country and size. The market stops being an estimate.
Markets compared
Shows of the same industry in other countries reveal where the players are and which segment is growing.
A decision with names
A report with real companies, exported to Sheets, useful for product and sales alike.
Frequently asked questions
How do I analyze an industry with trade show data?
Locate the industry's trade shows, extract their exhibitors and study the distribution by country, size and subsector. The result is a census of active companies, not an estimate.
How do I find every trade show in a niche?
DataOrigin classifies shows by industry and country. Search your niche and you get the events where its companies exhibit, with dates and cities.
Can I compare the same market across countries?
Yes. By analyzing shows of the same industry in different countries you can compare how many companies operate in each market and what profile they have.
Can I export the data for my own analysis?
Yes, to CSV, Excel and Google Sheets, or through the HubSpot, Zoho and Pipedrive integrations when the destination is sales.
Your next market is already exhibiting somewhere
Sign up for free and see how many companies from your vertical exhibit this year.
Try DataOrigin for free